
Air quality is an increasing concern in the industrialized world. According to the World Health Organization, (WHO), air pollution causes two million death annually in China, India and Pakistan. Moreover, ‘premature death’ of seven million people worldwide each year is due to the health hazards of air pollution. Several severe incidents of pollution haze afflicted Beijing, China, and attracted worldwide attention.
Monitoring air quality and particular matter (PM) as a function of space and time is critical for understanding the effects of industrial activities, studying atmospheric models and providing regulatory and advisory guidelines for transportation, residents and industries.
Currently, PM monitoring is performed at designated air sampling stations, which are regulated by the US Environmental Protection Agency (EPA) and similar agencies in different countries.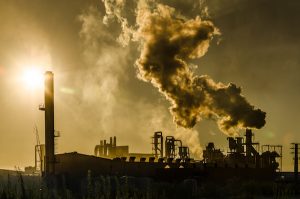
Air monitoring in the United States is conducted by many federal, state, local, and tribal air agencies. The U.S. Environmental Protection Agency (EPA) provides air pollution data about ozone and particulate matter (PM2.5) to CDC for the Tracking Network. The EPA maintains a database called the Air Quality System (AQS) which contains data from approximately 4,000 monitoring stations around the country, mainly in urban areas. Data from the AQS is considered the “gold standard” for determining outdoor air pollution. However, AQS data is limited because the monitoring stations are usually in urban areas or cities and because they only take air samples for some air pollutants every three days or during times of the year when air pollution is very high.
At a basic level, they let us know how clean or polluted the air is, help us track progress in reducing air pollution, and inform the public about air quality in their communities. The Tracking Network hosts and uses data from some of these sources to help paint a more complete picture of air quality in the United States.
In today’s modern society, it seems that globally we have personal trackers for everything. Tracking tools like FitBit, Strava and Garmin track our workouts; we can manually track our food consumption, while apps like Headspace monitor our mental health.
Romain Lacombe, a French engineer and data specialist with a background in climate research, noticed a gap in the tracking and monitoring market. He found that there seemed to be no way to track our personal exposure to pollution.
“What people don’t realize about pollution and air quality is how local it is,” Lacombe says. Unlike the weather, he adds, air quality isn’t consistent across a city; it fluctuates block by block. Busy roads, for example, will have worse air quality than quiet, car-free streets due to emissions from traffic-jammed cars, and the blocks around a coal-burning plant or factory will often contain unhealthy levels of particulate matter in the air. The siting of factories in lower-income neighborhoods of color has become a rallying point for environmental justice advocates, who argue that corporate interests are damaging the health of people who live near the facilities and often have no control over where they are located, but still must cope with the consequences.
To that end, Lacombe created an app that users can use to see how particulate matter and ozone levels will fluctuate in their city over the next 24 hours, and plan accordingly. Over 100,000 people worldwide use the app, Lacombe says, “and we’ve heard from people that it’s helped them to change their daily routines.” A pop-up notification warning of excess smog, for instance–a reading of around 115 on the Air Quality Index–will inform a user that it might be best to postpone marathon training until the air clears.
But he is not stopping there. Development in underway for a handheld device that will actually collect and transmit the data to a central station, which can assist in the data and research being collected globally and help to better understand the affects PM and other hazardous air quality have on longevity.
On account of these limitations, many air sampling activities continue to use microscopic inspection and counting. Basically, air samples are manually obtained in the field using a portable sampler that employs various processes, such as cyclonic collection, impingement, impaction, thermophoresis or filtering 11, 12, 13, 14. The sample is then sent to a central laboratory, where it is post-processed and manually inspected under a microscope by an expert. This type of microscopic analysis provides the major advantage of more accurate particle sizing, while enabling the expert reader to recognize the particle shape and type. These capabilities yield additional benefits in more complicated analyses of air pollution, such as identification of a specific aerosol type. In this method, however, the sampling and inspection processes are separated; that is, the sampling is performed in the field, whereas the sample analysis is conducted in a remote professional lab. This significantly delays the reporting of the results. Additionally, the inspection is manually performed by a trained expert, which considerably increases the overall cost of each air-quality measurement. Furthermore, this conventional microscope-based screening of aerosols cannot be conducted in the field, because these benchtop microscopes are cumbersome, heavy, expensive and require specialized skills to operate.
At Universe Optics, we engineer and manufacture lenses to meet the growing needs for the planetary sciences, medical equipment, military and many more. We can custom design a solution for your needs.
“The long-term vision is that the more information people have about the air and how it affects their health, the more support they will be able to generate for policies that reduce pollution,” Lacombe says.